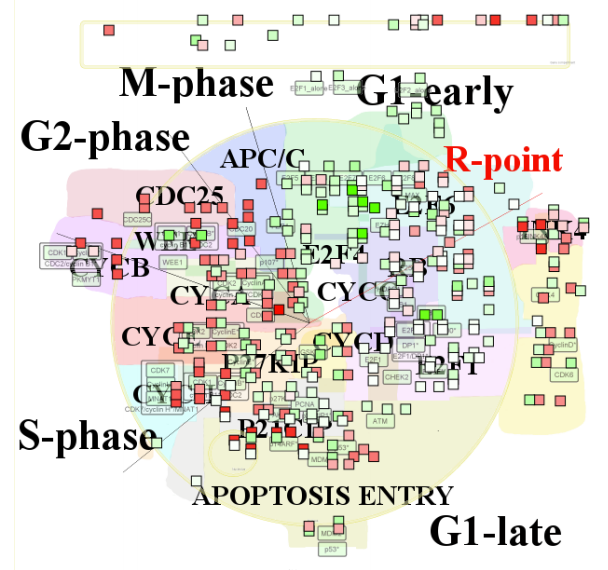
ACSN: Atlas of Cancer Signaling Network
ACSN is a pathway database and a web-based environment that contains a collection of interconnected cancer-related signalling network maps and allows omics data visualization and analysis.
NaviCell: browsing large networks using Google Maps

A web tool and a web service for exploring large maps of molecular interactions and visualizing data on top of them.
BiNoM: Biological Network Manager
BiNoM is a Cytoscape plugin, developed to facilitate the manipulation of biological networks represented in standard systems biology formats (SBML, SBGN, BioPAX) and to carry out studies on the network structure. BiNoM provides the user with a complete interface for the analysis of biological networks in Cytoscape environment.
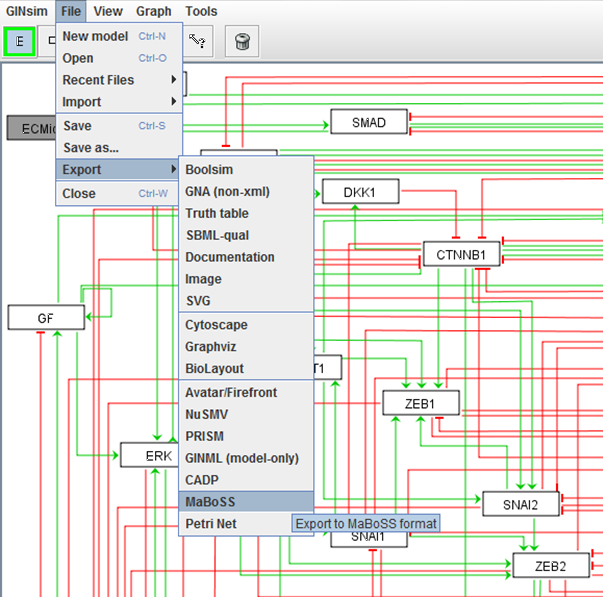
MaBoSS: Boolean network model simulator
MaBoSS is a C++ software for simulating continuous/discrete time Markov processes, applied on a Boolean network.
Logical modelling pipeline
pipeline of computational methods for logical modelling of biological networks that are deregulated in diseases.
PhysiBOSS: Software for multiscale simulation of multi-cellular system

PhysiBoSS (PhysiCell-MaBoSS) is C++ software for multiscale simulation of heterogeneous multi-cellular system. It combines agent-based physical simulations and the possibility to integrate any Boolean network into an agent. PhysiBOSS provide a flexible and computationally efficient framework to study heterogeneous cell population growth in diverse experimental set-ups.
OCSANA: computing optimal minimal cut sets for complex and large networks
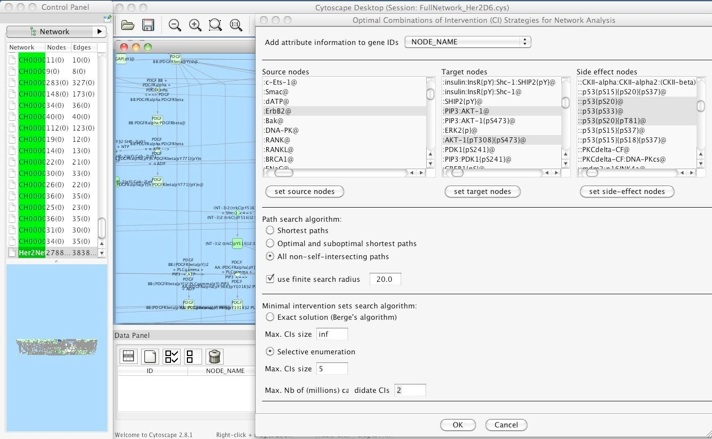
OCSANA (Optimal Combinations of Interventions from Network Analysis) is a new software designed to identify and prioritize optimal and minimal, combinations of interventions to disrupt the paths between source nodes and target nodes.
DeDaL: data-driven network layouts
DeDaL is a Cytoscape 3.0 app which uses several algorithms of dimention reduction to produce data-driven network layouts based on multidimensional data (typicaly gene expression)..
NETI: network reverse engineering
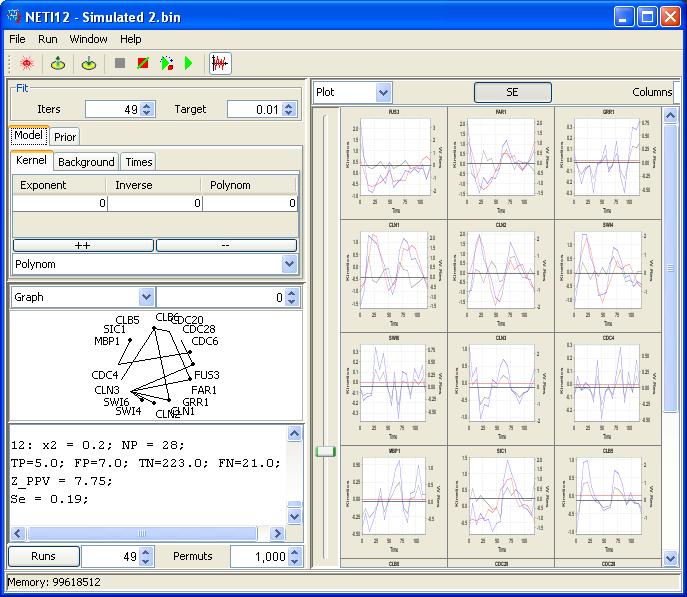
Generalized approach for the reconstruction of regulatory networks from time-series data. This approach uses elements of control theory and the space-state formalism to approximate interactions between two observable nodes (e.g. measured genes).
ROMA: Calculation of gene set activities from omics data

ROMA is a software package written in Java for the quantification and representation of biological module activity using gene expression or other omics data.
ROMA Dashboard: complete R shiny interface for quantifying and visualizing gene signatures

Complete set of analysis and visualization tools for overdispersion, overcoordination, overexpression analysis of gene signatures and scoring them sample-wise, using transcriptomics and quantitative proteomics data.
InfoSigMap: map of functional redundancies between informative gene sets
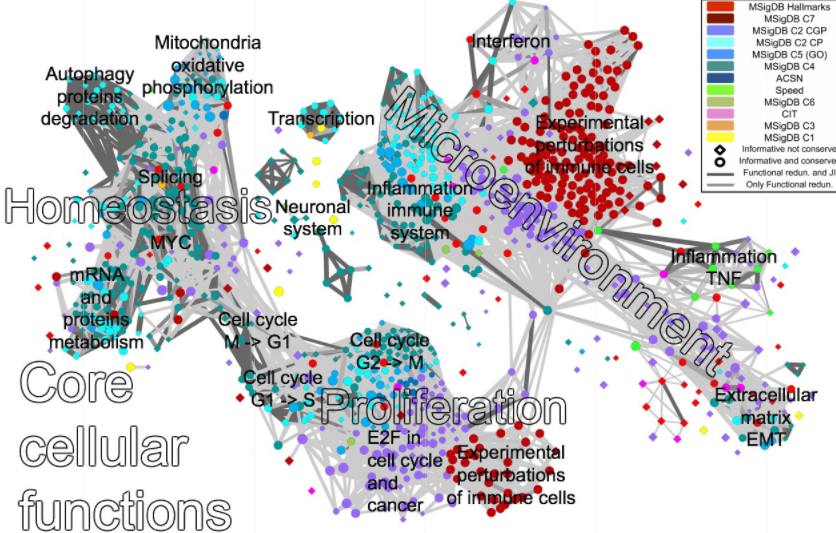
The map shows connections between approximately 1000 selected informative gene signatures, grouping them by their biological function. InfoSigMap can be used for visualization of omics data and its analysis for easy visual interpretation.
NaviCom: bridge betweem cBioPortal and ACSN databases
A web-based application for generating interactive network based molecular portraits using high-throughput datasets, using NaviCell
ACSNmineR: Gene Enrichment Analysis from ACSN Maps
Computing and represent gene set enrichment or depletion from user data based on the molecular interaction maps from the Atlas of Cancer Signalling Network (ACSN) or maps imported by a user.
NetNorm: normalizing binary mutation data with biological networks
The tool allows better use of mutation data in multivariate analysis, including survival prediction and patient stratification. NetNorm is based on using a biological network for transforming the binary mutation matrix.
ViDaExpert: 3D interface for data visualization
ViDaExpert is a user-friendly tool for nonlinear visualization and analysis of multidimensional vectorial data. It implements standard methods such as PCA, but also non-linear versions of principal manifolds. ViDaExpert is equipped with convinient 3D user interface.
ElMap: non-linear principal manifolds
elmap - is a tool for fast construction of non-linear principal manifolds of various topologies in multidimensional data space, for a discrete set of weightened points.
ElPiGraph : robust principal graphs for pseudo-time analysis in single cell data
Package for advanced analysis of omics data topologies (principal curves, principal circles, principal trees and graphs)
Link to the R implementation, MATLAB implementation ...
PQSQ data approximators
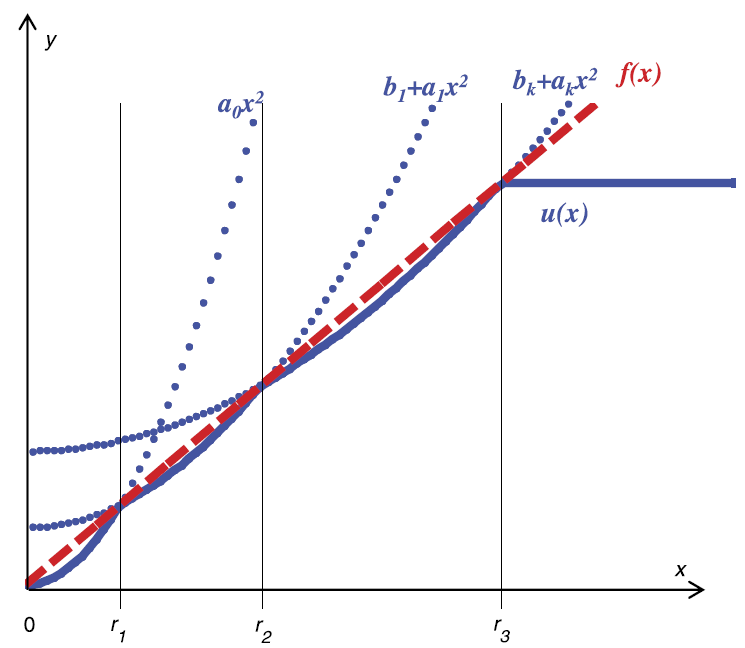
Piece-wise quadratic of subquadratic growth (PQSQ) data approximators is generalization of classical machine learning methods (PCA, regularized regression) for the use of non-quadratic error functions. PQSQ-based trick allows creating fast implementations of exploratory data analysis tools robust to the presence of strong noise.
BIODICA: Independent Component Analysis for Big Omics Data

BIODICA is a user-friendly pipeline for high-performant computation of independent components for omics data, using stability analysis and computing the optimal number of the components from their stabilities, and performing analyses for interpreting the results of ICA application.
Control-FREEC: copy number and genotype caller

Control-FREEC is a tool for detection of copy-number changes and allelic imbalances (including LOH) using deep-sequencing data.
MICSA: Motif Identification for ChIP-Seq Analysis

MICSA is package for the identification of transcription factor binding sites in ChIP-Seq data
Nebula: Galaxy pipeline for ChiP-Seq Analysis

A web service provided by Institut Curie and powered by Galaxy which allows users (Bioinformaticians as far as Biologists) to analyze their ChIP-seq data.
SV-Bay: structural variant detection in cancer genomes
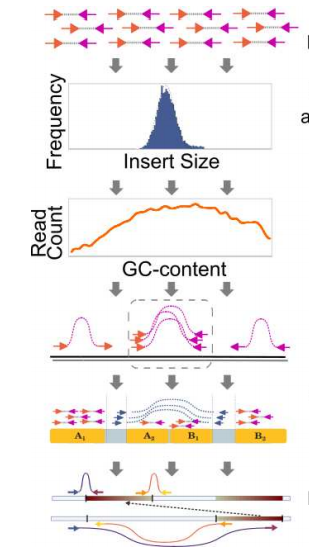
Structural variant detection in cancer genomes using a Bayesian approach with correction for GC-content and read mappability.
RNFTools: NGS read mapper evaluator
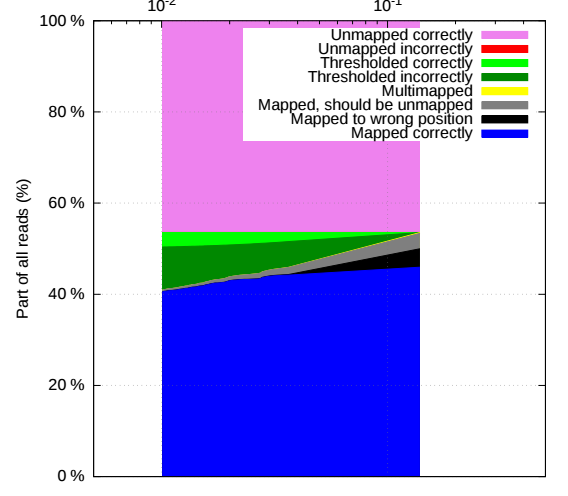
RNFTools simplifies evaluation of read mappers and debugging of tools for NGS data analysis...
SVDetect: genomic structural variations detector
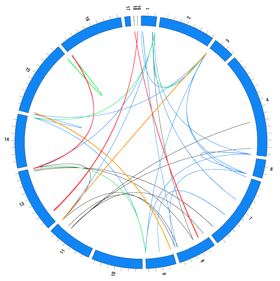
SVDetect is an application for the isolation and the type prediction of intra- and inter-chromosomal rearrangements from paired-end/mate-pair sequencing data provided by the high-throughput sequencing technologies